
This is something I've been wanting to get around to for a while, just to see how this unit that I've been using a while stacks up. As it turns out, there were a few surprises... which should be put into context, and highlight where dichotomies can come up in comparing the audible performance in a typical setup versus the outline of how it benches. Without further adieu, let's get started.
Basic frequency response and level tracking
Figure 1: Frequency response and channel balance at 0dB attenuation, Balanced output, +1 dBV level
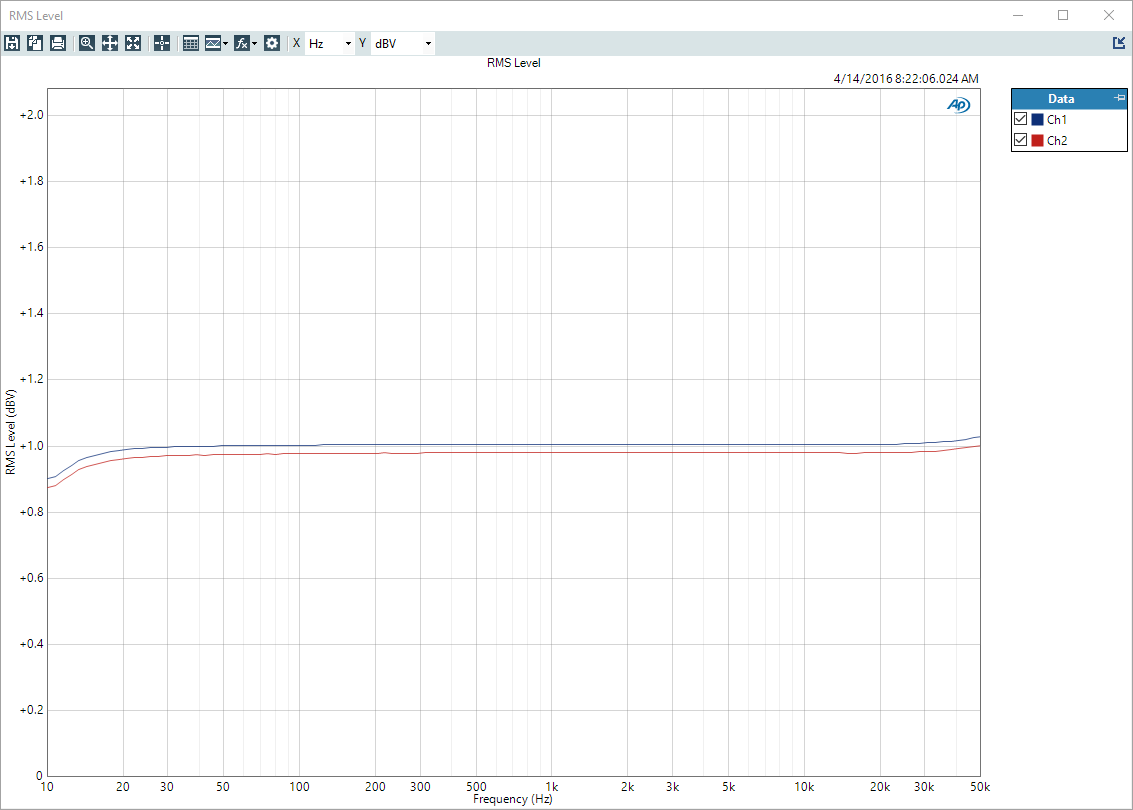 Frequency_0dB by Jon Hancock, on Flickr
This is just an indicator of overall flatness of frequency response in the audio band, and how tightly the channel gains track. Channel tracking is very good, about 0.1 dB, and flatness from 20Hz to 20kHz is quite good.
This is a check with the volume control set to -20dB; this is the sort of thing that gives resistor pots problems, because it's hard to get the log resistor elements to track well over a wide range. Because the 851E uses a multiplying DAC as the gain control resistor element, tracking is very tight over a wide attenuation range.
Figure 2: Frequency response and channel balance at -20dB attenuation, Balanced output, +1 dBV level
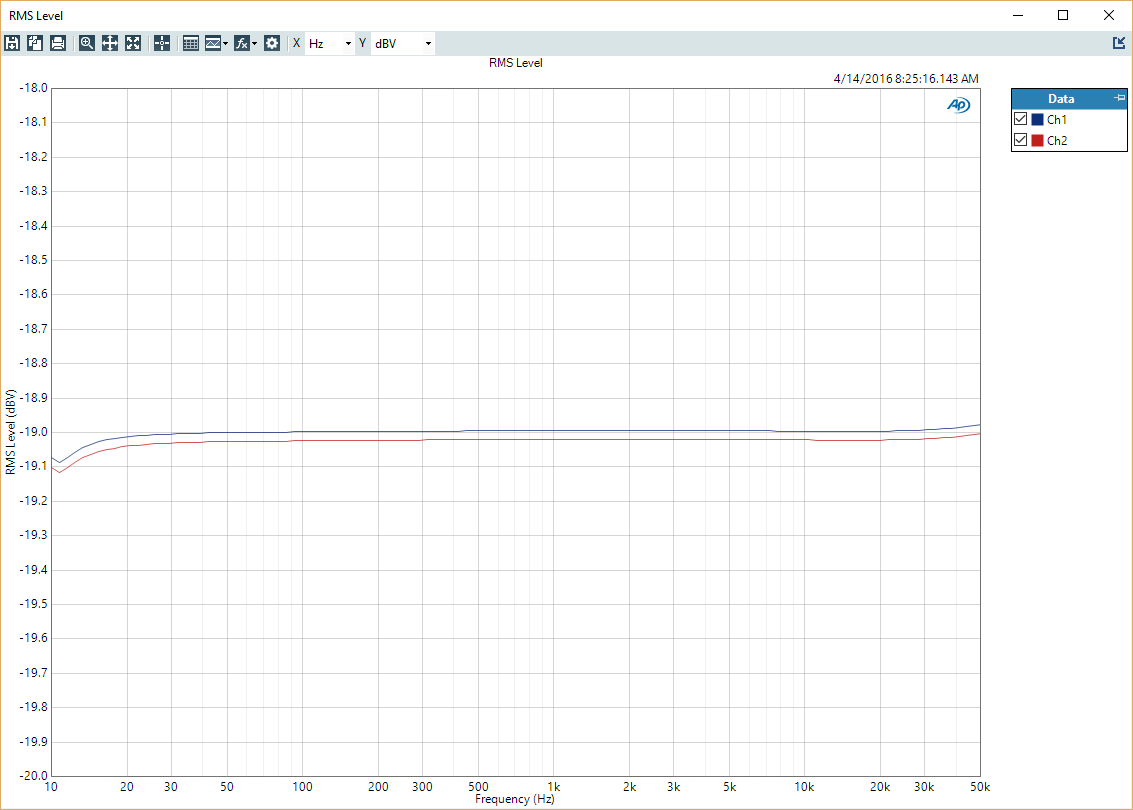 Frequency_-20dB by Jon Hancock, on Flickr
Level Swept THD+N measurement at 1 kHz
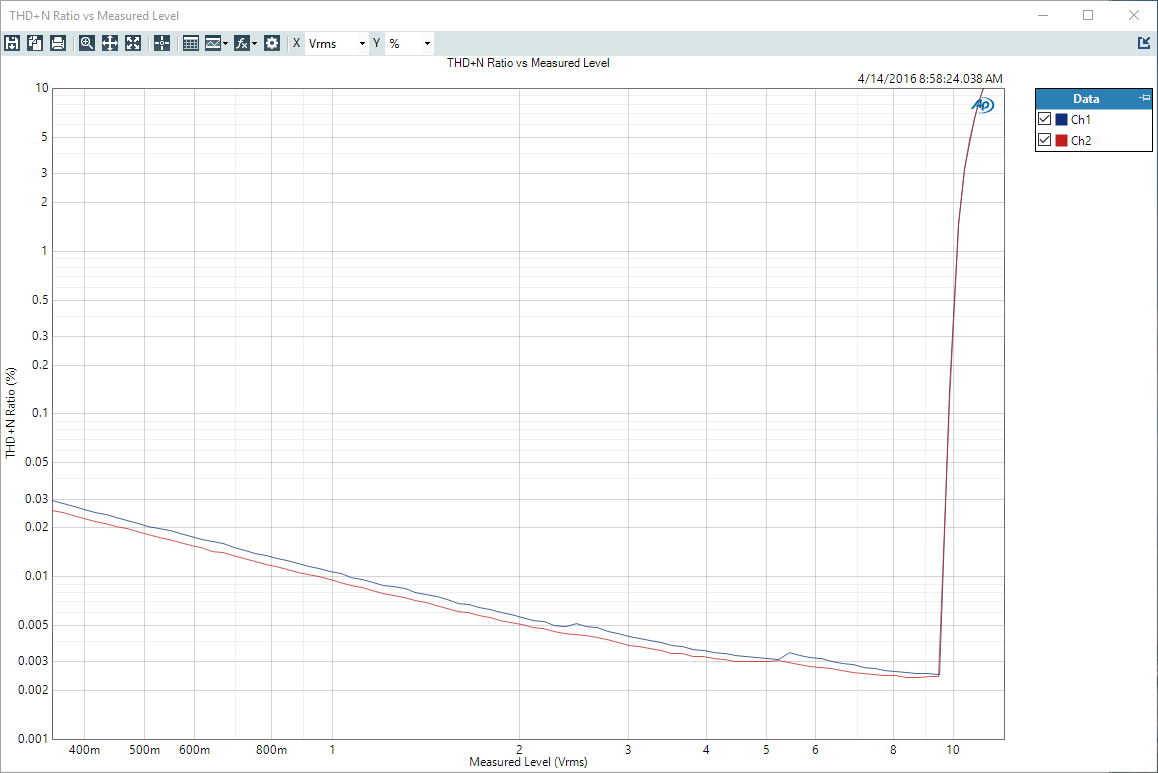
This next test is a basic measure of the THD (total harmonic distortion) + Noise in proportion to the input level, which is swept from a low level signal to high level, with the volume control set to max.
Figure 3: THD+N versus output level, 0dB attenuation on volume control, balanced inputs and outputs
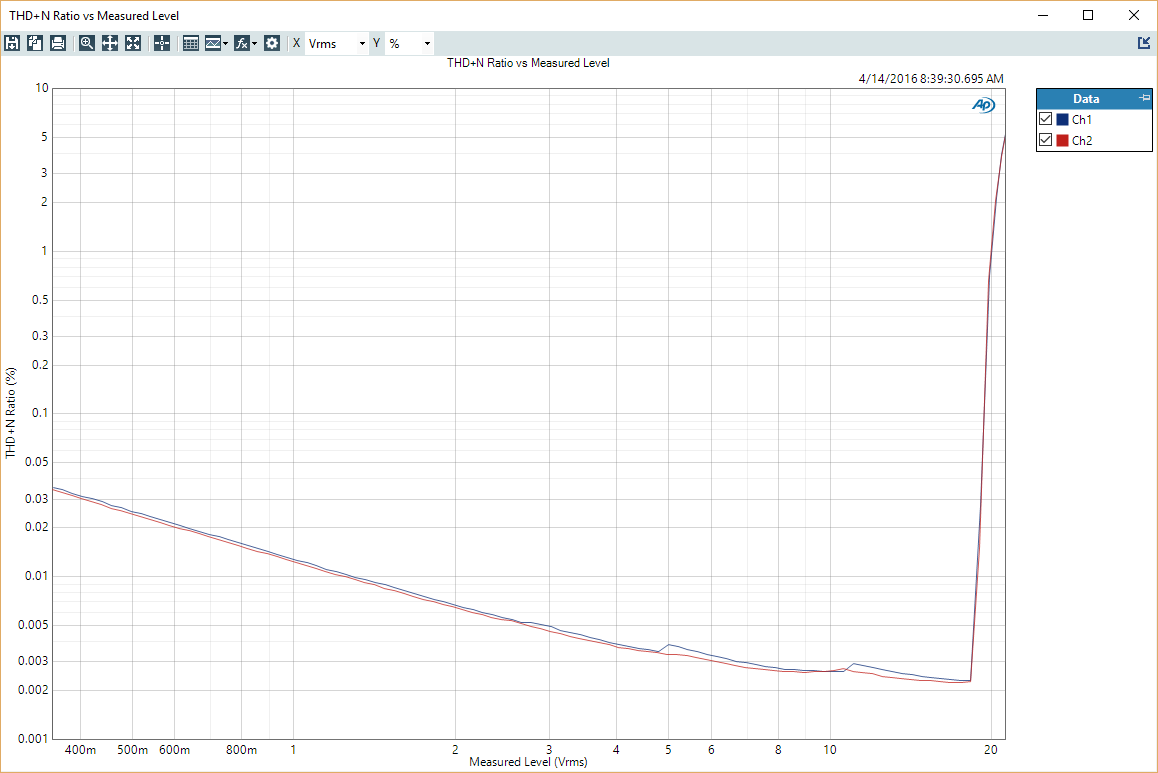 balanced 1kHz THD+N-Level by Jon Hancock, on Flickr
At typical RMS output levels to drive many power amps near full output, THD+N is in the range of 0.01% to 0.007%.
This isn't "bad" per se, but it is not what I was expecting, based on Cambridge Audio's claims of 0.0005% typical THD. Ah, therein lies the clue, it will turn out.
To further investigate, I measured this again with unbalanced inputs and balanced outputs, and unbalanced inputs and outputs, incase their was additional noise contribution from extra circuit to realize the balancing interfaces.
Figure 4: THD+N versus output level, 0dB attenuation on volume control, unbalanced inputs and balanced outputs
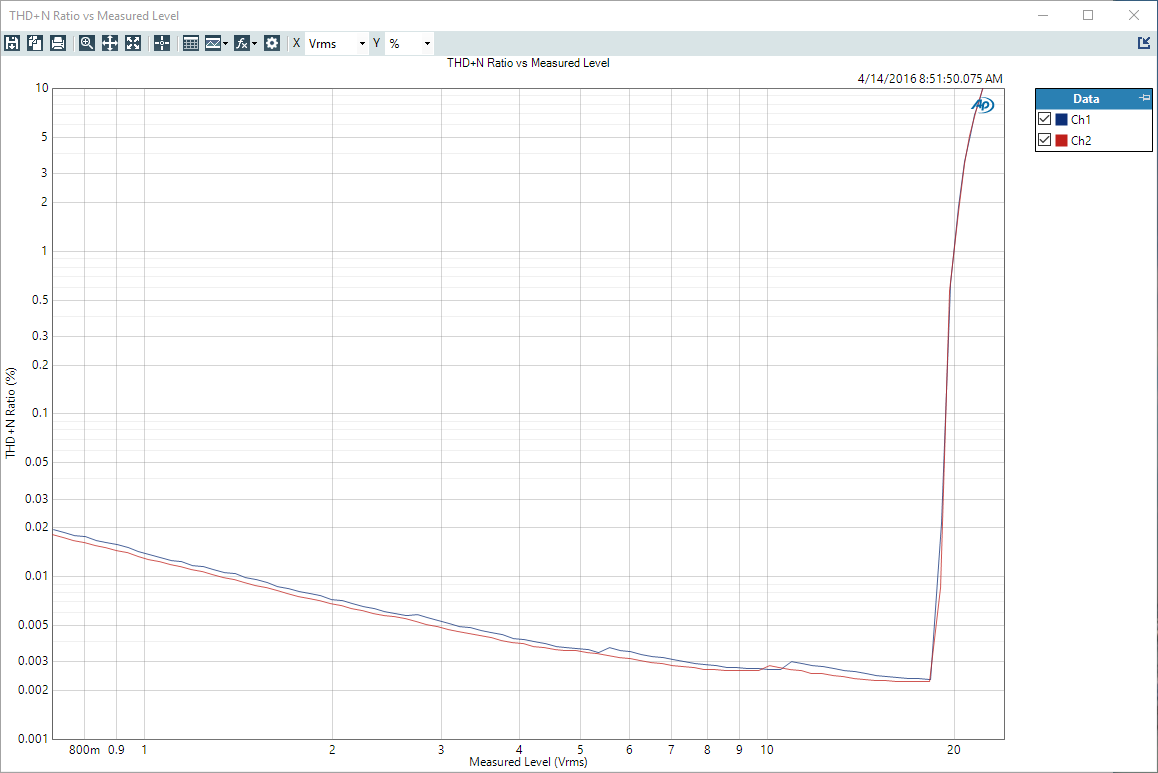 unbalanced-balanced 1kHz THD+N-Level by Jon Hancock, on Flickr
Figure 5: THD+N versus output level, 0dB attenuation on volume control, unbalanced inputs and outputs
 unbalanced-unbalanced 1kHz THD+N-Level by Jon Hancock, on Flickr
Pretty much consistent behavior, with the expected cutting in half of maximum output voltage for the unbalanced output configuration. This kind of uniform decline of THD+N with increasing level is an indicator that performance is limited by noise of some kind, and THD is not increasing with increasing output level due to limitations in level handling capability. This is going to take more investigation.
Frequency Swept THD+N measurement at 4VRMS output
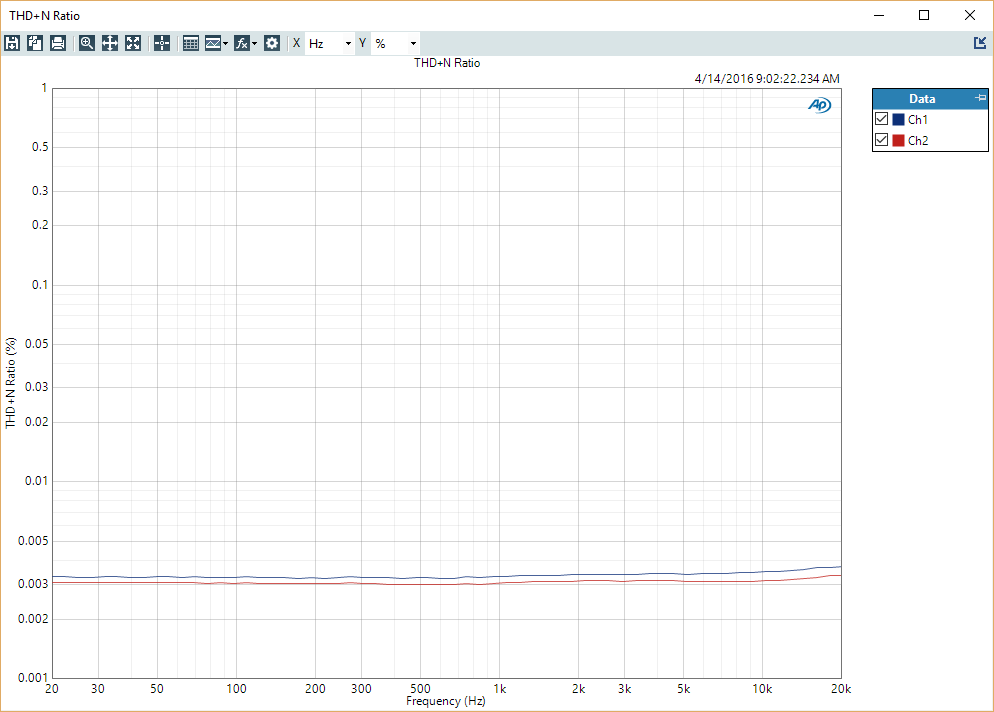
Here, we're going to look at how the THD+N varies as a function of swept frequency; often distortion is higher at the frequency extremes than at 1 kHz. We'll use a 4VRMS output level which has been shown to be a fairly clean operating point with the previous 1kHz measurement.
Figure 6: THD+N versus output frequency, 0dB attenuation on volume control, unbalanced inputs and outputs, 100kOhm load
 FreqSweep_4VRMS-100K by Jon Hancock, on Flickr
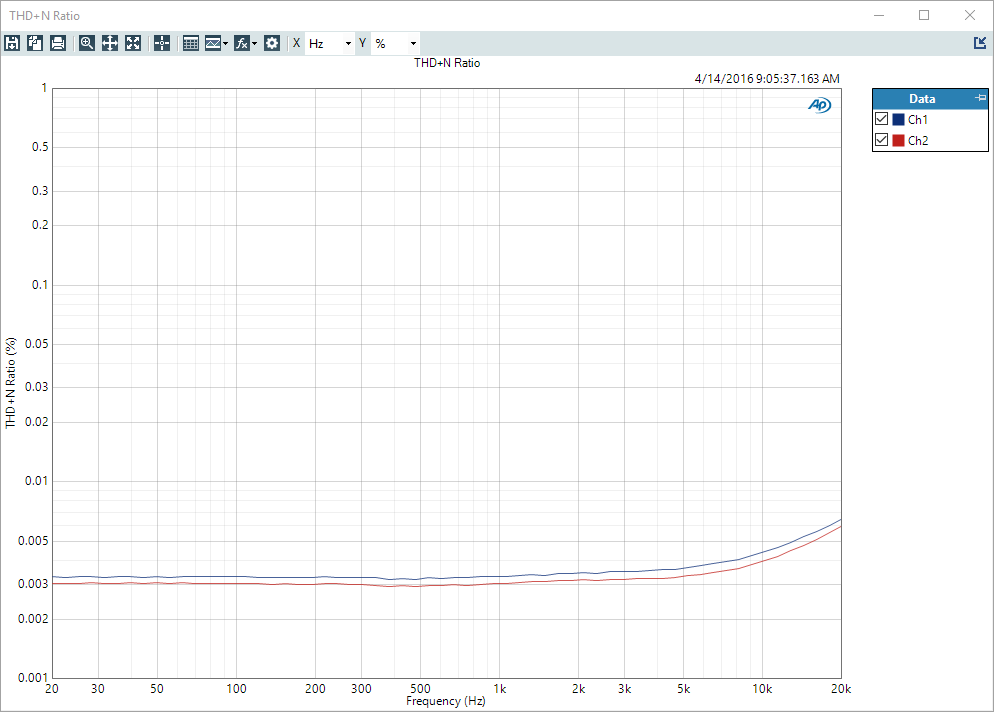
Figure 7: THD+N versus output frequency, 0dB attenuation on volume control, unbalanced inputs and outputs, 600 Ohm load (professional loading; not normally seen in home equipment)
 FreqSweep_4VRMS-600Ohms by Jon Hancock, on Flickr
The consistency with regards to frequency is very good; in a home environment, the results will look like Figure 6; with a professional 600 Ohm load (actually, not often encountered even in a studio environment) there is only a small increase in high frequency distortion).
1 kHz LF FFT
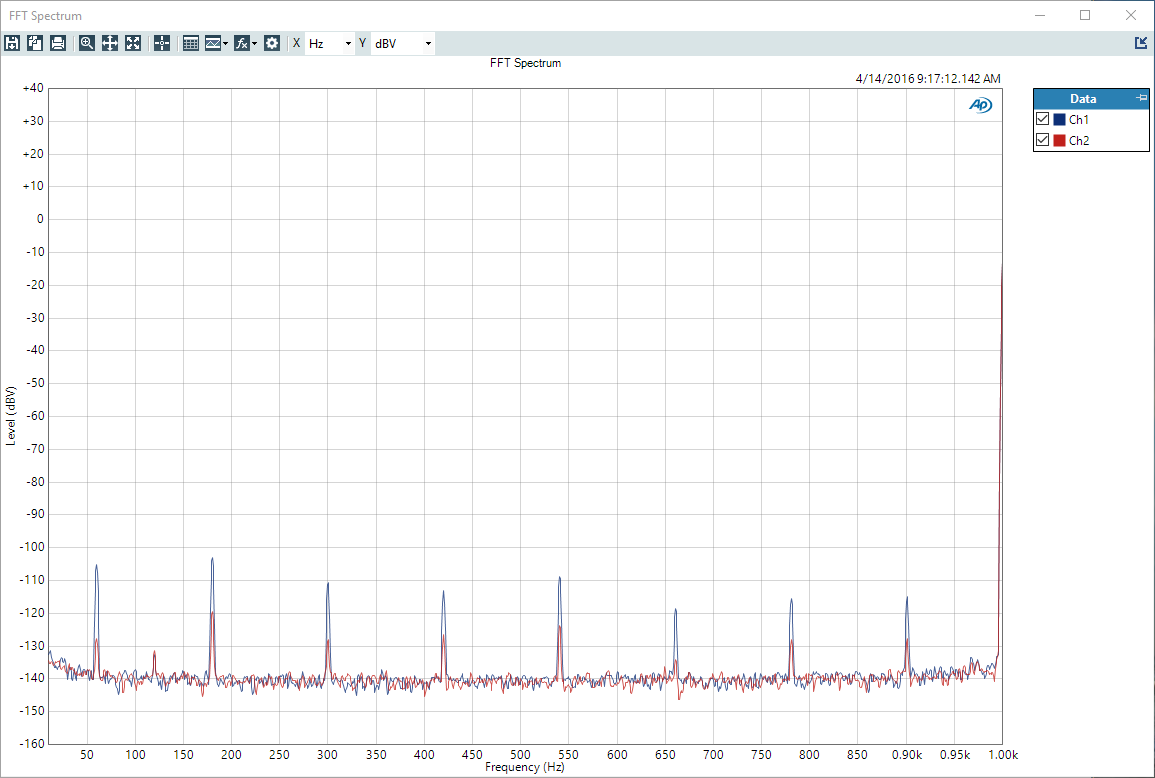
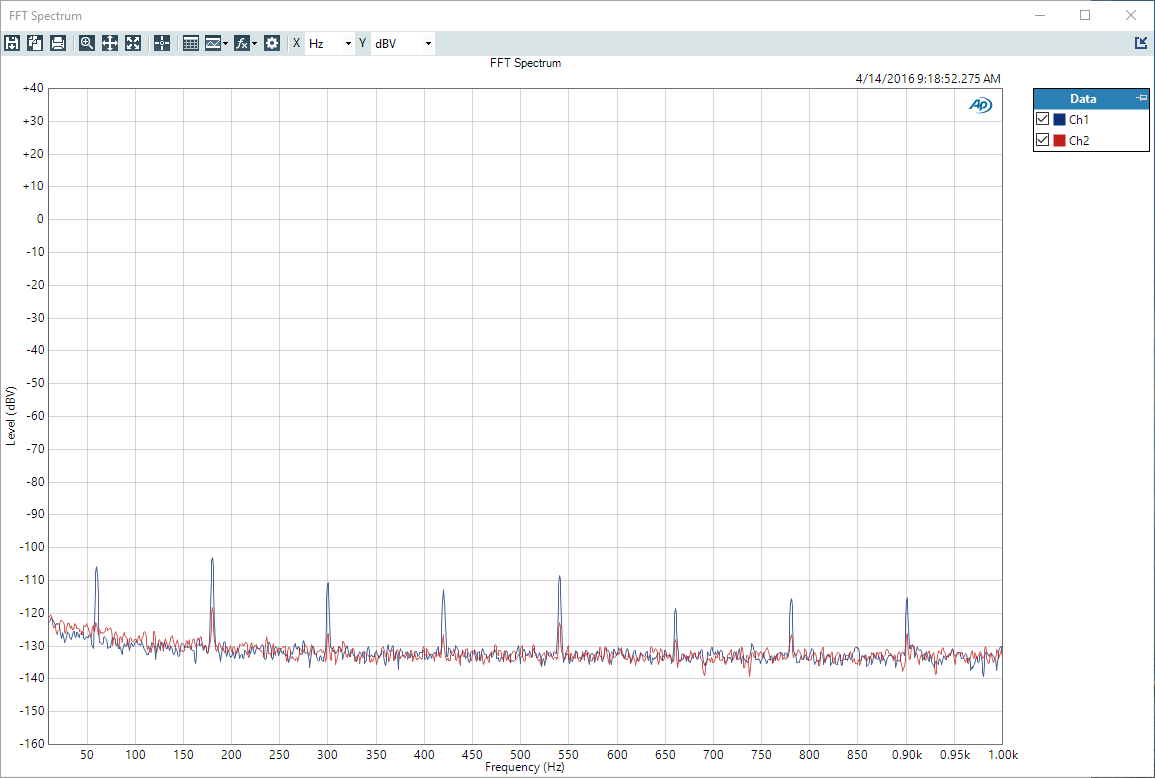
Now we're going to take a look at the DC-1kHz spectrum while playing a mid level 1KHz tone; in this case, the input signal to the preamp was 100mV.
Figure 8: FFT from DC-1kHz with 100mV 1kHz input, - 0 dB attenuation
 100mVIn_1kHzUnblancedFFT-AC_Noise by Jon Hancock, on Flickr
Now the picture is falling into place. See all of these spikes at 60Hz, 120Hz, 180Hz, etc? These are all line frequency multiples, typical of the buzz noise from AC line rectifiers, varying in level from -120 dB to about -103 dB. This is what is likely "killing" the THD+N measurement and causing it to fall short of Cambridge Audio's claims of 0.0005%.
What happens if we remove the inputs completely?
Figure 8: FFT from DC-1kHz with no input, - 0 dB attenuation
 No-VIn_1kHzUnblancedFFT-AC_Noise by Jon Hancock, on Flickr
Still there, this is basically an internal residual noise floor. We'd never even notice this in the 70's and 80's, as it's well below what equipment produced then could muster or measure. But this is the 21st century- have our ears gotten this good, though?
50Hz Output FFT
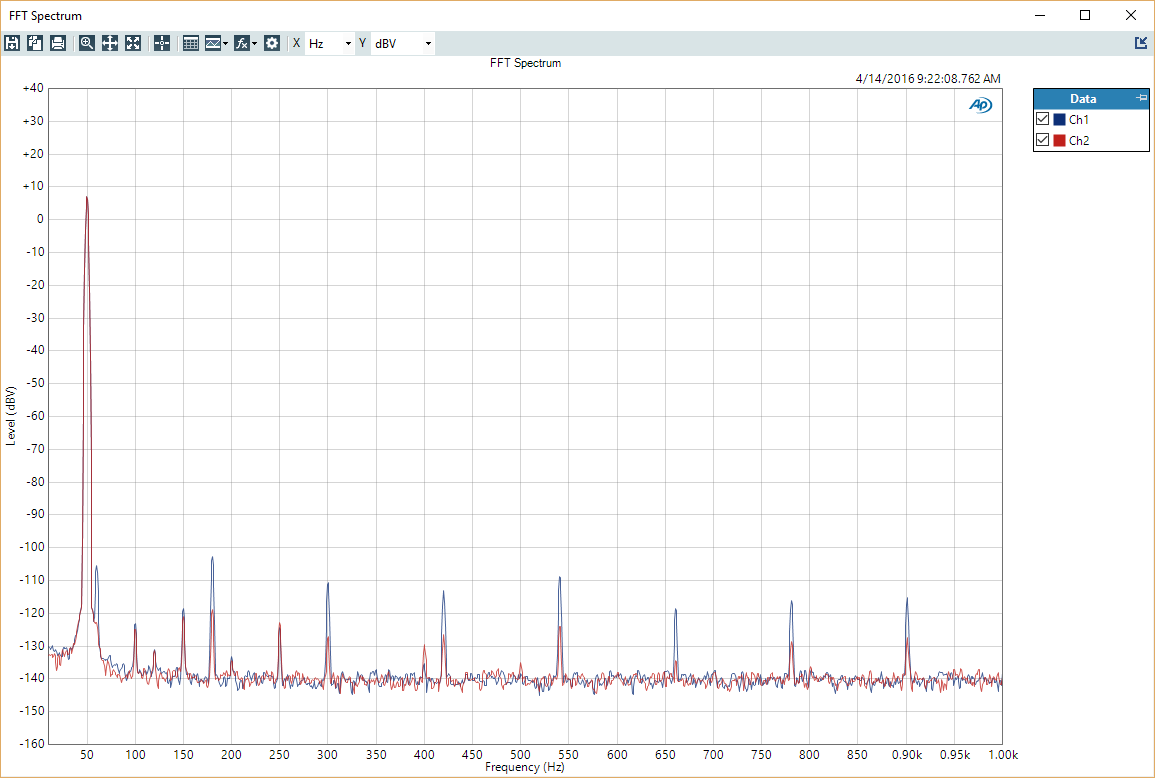
Let's go look at the 50Hz LF test, with output level at about +7 dBV.
Figure 9: FFT from DC-1kHz with 50Hz input, - 0 dB attenuation
 50HzUnblancedFFT-AC_Noise by Jon Hancock, on Flickr
Actual THD components are fairly low, at or below -120 dB and dropping- but there is a nice spread of line harmonics still.
19+20kHz CCIF High Frequency intermodulation Distortion
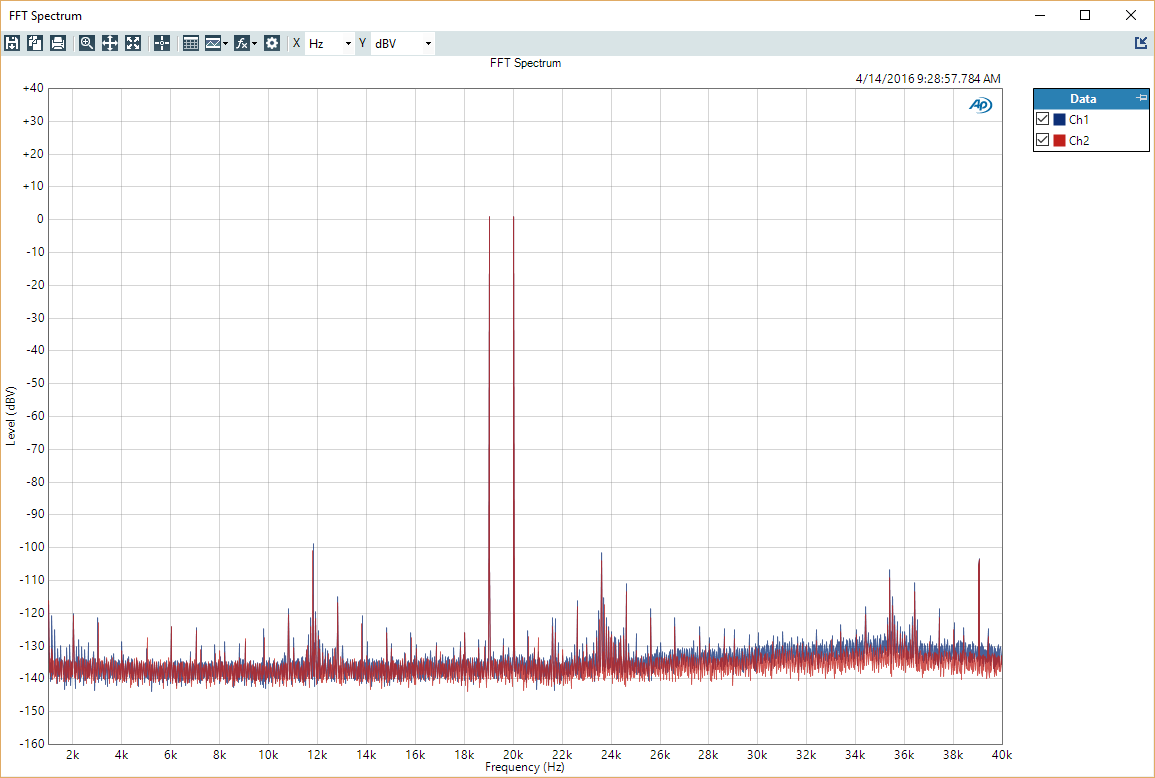
Last up test is the High Frequency intermodulation, first, measured for a nominal peak output level equivalent to a sine wave RMS level of 1.5V.
Now we're looking at an FFT from 1kHz and up to 40kHz.
Figure 10: FFT from 1kHz to 40kHz with 19+20kHz input, - 0 dB attenuation
 19-20K_CCIF_FFT by Jon Hancock, on Flickr
We'd usually just expect to see some different frequency side bands at 1 kHz intervals around the test signals, and down at the 1kHz and 2 kHz area.. what's all this stuff at 12 and 24kHz and around them?
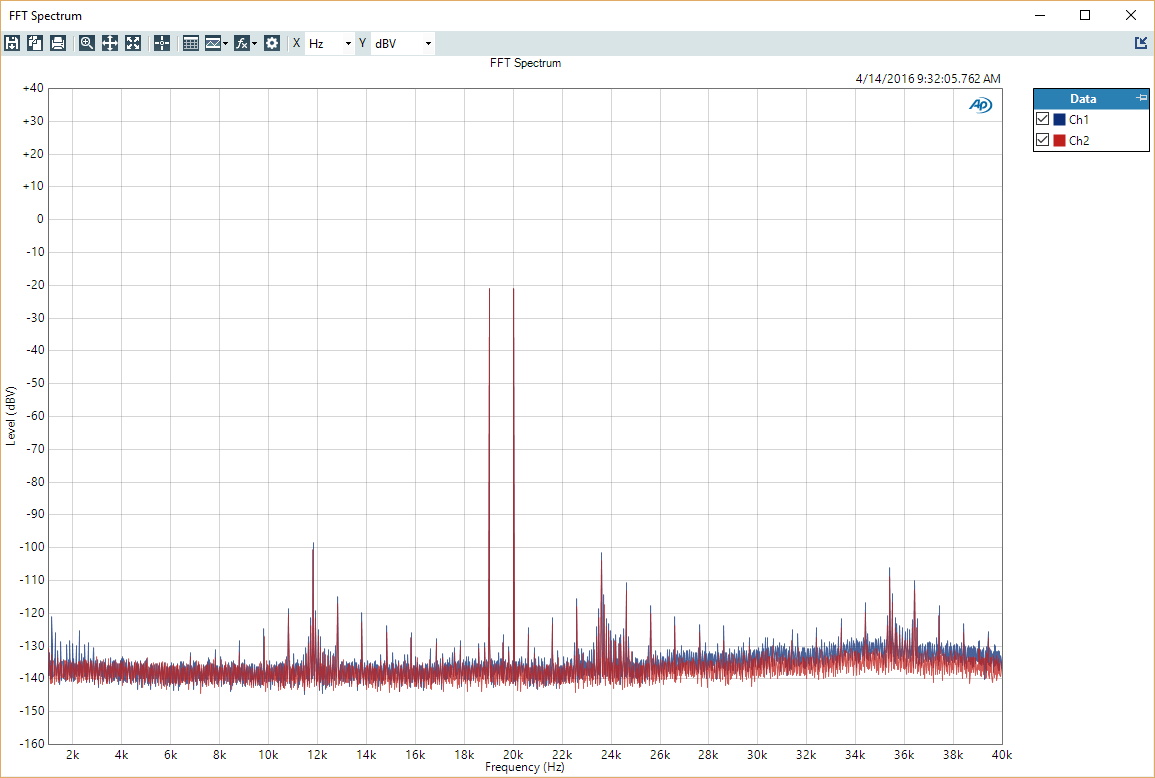
I ran the same test and dropped the input level to just 50mV...
Figure 11: FFT from 1kHz to 40kHz with 19+20kHz input, - 0 dB attenuation
 50mV_Input19-20K_CCIF_FFT by Jon Hancock, on Flickr
Well, the "stuff" (that's the technical term) at 12kHz and multiples thereof is still around at the same levels, so I'm kind of forced to conclude it's "internal pollution" from a power supply or some other noise source. Yes, the absolute level is fairly low, but Geez, it doesn't make me feel particularly good about how this unit is working. Can you hear it directly? I suppose, the question would be, if they had a unit WITHOUT that additional noise, would it sound better in any sense?
One reason I bring up this point, is that if one setup the Cambridge Audio 851D Digital Preamp as a DAC, and ran it through the 851E analog preamp, the results aren't nearly as good as the measurements I posted recently in the Digital Audio section for the 851D preamp, which DOES have an analog volume control based on the same concept as the 851E, using a multiplying DAC.
For comparison, here is the 851D on the same type of CCIF HF intermodulation test, with the volume control enabled, at 0 dB attenuation:
 CCIF_18-19kHz by Jon Hancock, on Flickr
That is certainly food for thought, as it increases the potential value proposition for the 851D.
Meanwhile, I think I'm going to have to setup the AURALiC Vega in the main system with the TotalDAC and see what I think about that- a little low level channel imbalance doesn't strike me as much of a problem right now... :W
Basic frequency response and level tracking
Figure 1: Frequency response and channel balance at 0dB attenuation, Balanced output, +1 dBV level
Frequency_0dB by Jon Hancock, on FlickrThis is just an indicator of overall flatness of frequency response in the audio band, and how tightly the channel gains track. Channel tracking is very good, about 0.1 dB, and flatness from 20Hz to 20kHz is quite good.
This is a check with the volume control set to -20dB; this is the sort of thing that gives resistor pots problems, because it's hard to get the log resistor elements to track well over a wide range. Because the 851E uses a multiplying DAC as the gain control resistor element, tracking is very tight over a wide attenuation range.
Figure 2: Frequency response and channel balance at -20dB attenuation, Balanced output, +1 dBV level
Frequency_-20dB by Jon Hancock, on FlickrLevel Swept THD+N measurement at 1 kHz
This next test is a basic measure of the THD (total harmonic distortion) + Noise in proportion to the input level, which is swept from a low level signal to high level, with the volume control set to max.
Figure 3: THD+N versus output level, 0dB attenuation on volume control, balanced inputs and outputs
balanced 1kHz THD+N-Level by Jon Hancock, on FlickrAt typical RMS output levels to drive many power amps near full output, THD+N is in the range of 0.01% to 0.007%.
This isn't "bad" per se, but it is not what I was expecting, based on Cambridge Audio's claims of 0.0005% typical THD. Ah, therein lies the clue, it will turn out.
To further investigate, I measured this again with unbalanced inputs and balanced outputs, and unbalanced inputs and outputs, incase their was additional noise contribution from extra circuit to realize the balancing interfaces.
Figure 4: THD+N versus output level, 0dB attenuation on volume control, unbalanced inputs and balanced outputs
unbalanced-balanced 1kHz THD+N-Level by Jon Hancock, on FlickrFigure 5: THD+N versus output level, 0dB attenuation on volume control, unbalanced inputs and outputs
unbalanced-unbalanced 1kHz THD+N-Level by Jon Hancock, on FlickrPretty much consistent behavior, with the expected cutting in half of maximum output voltage for the unbalanced output configuration. This kind of uniform decline of THD+N with increasing level is an indicator that performance is limited by noise of some kind, and THD is not increasing with increasing output level due to limitations in level handling capability. This is going to take more investigation.
Frequency Swept THD+N measurement at 4VRMS output
Here, we're going to look at how the THD+N varies as a function of swept frequency; often distortion is higher at the frequency extremes than at 1 kHz. We'll use a 4VRMS output level which has been shown to be a fairly clean operating point with the previous 1kHz measurement.
Figure 6: THD+N versus output frequency, 0dB attenuation on volume control, unbalanced inputs and outputs, 100kOhm load
FreqSweep_4VRMS-100K by Jon Hancock, on FlickrFigure 7: THD+N versus output frequency, 0dB attenuation on volume control, unbalanced inputs and outputs, 600 Ohm load (professional loading; not normally seen in home equipment)
FreqSweep_4VRMS-600Ohms by Jon Hancock, on FlickrThe consistency with regards to frequency is very good; in a home environment, the results will look like Figure 6; with a professional 600 Ohm load (actually, not often encountered even in a studio environment) there is only a small increase in high frequency distortion).
1 kHz LF FFT
Now we're going to take a look at the DC-1kHz spectrum while playing a mid level 1KHz tone; in this case, the input signal to the preamp was 100mV.
Figure 8: FFT from DC-1kHz with 100mV 1kHz input, - 0 dB attenuation
100mVIn_1kHzUnblancedFFT-AC_Noise by Jon Hancock, on FlickrNow the picture is falling into place. See all of these spikes at 60Hz, 120Hz, 180Hz, etc? These are all line frequency multiples, typical of the buzz noise from AC line rectifiers, varying in level from -120 dB to about -103 dB. This is what is likely "killing" the THD+N measurement and causing it to fall short of Cambridge Audio's claims of 0.0005%.
What happens if we remove the inputs completely?
Figure 8: FFT from DC-1kHz with no input, - 0 dB attenuation
No-VIn_1kHzUnblancedFFT-AC_Noise by Jon Hancock, on FlickrStill there, this is basically an internal residual noise floor. We'd never even notice this in the 70's and 80's, as it's well below what equipment produced then could muster or measure. But this is the 21st century- have our ears gotten this good, though?
50Hz Output FFT
Let's go look at the 50Hz LF test, with output level at about +7 dBV.
Figure 9: FFT from DC-1kHz with 50Hz input, - 0 dB attenuation
50HzUnblancedFFT-AC_Noise by Jon Hancock, on FlickrActual THD components are fairly low, at or below -120 dB and dropping- but there is a nice spread of line harmonics still.
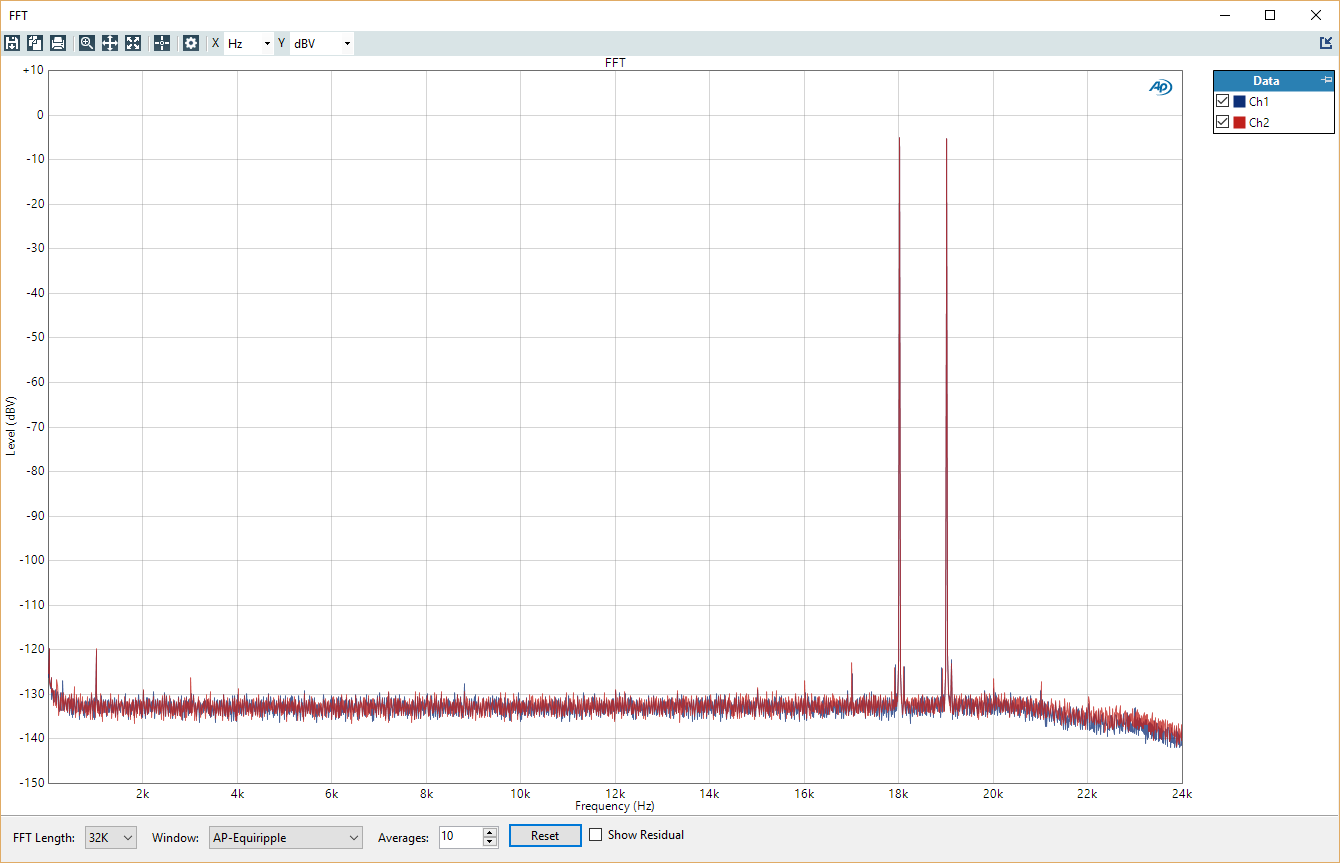
19+20kHz CCIF High Frequency intermodulation Distortion
Last up test is the High Frequency intermodulation, first, measured for a nominal peak output level equivalent to a sine wave RMS level of 1.5V.
Now we're looking at an FFT from 1kHz and up to 40kHz.
Figure 10: FFT from 1kHz to 40kHz with 19+20kHz input, - 0 dB attenuation
19-20K_CCIF_FFT by Jon Hancock, on FlickrWe'd usually just expect to see some different frequency side bands at 1 kHz intervals around the test signals, and down at the 1kHz and 2 kHz area.. what's all this stuff at 12 and 24kHz and around them?
I ran the same test and dropped the input level to just 50mV...
Figure 11: FFT from 1kHz to 40kHz with 19+20kHz input, - 0 dB attenuation
50mV_Input19-20K_CCIF_FFT by Jon Hancock, on FlickrWell, the "stuff" (that's the technical term) at 12kHz and multiples thereof is still around at the same levels, so I'm kind of forced to conclude it's "internal pollution" from a power supply or some other noise source. Yes, the absolute level is fairly low, but Geez, it doesn't make me feel particularly good about how this unit is working. Can you hear it directly? I suppose, the question would be, if they had a unit WITHOUT that additional noise, would it sound better in any sense?
One reason I bring up this point, is that if one setup the Cambridge Audio 851D Digital Preamp as a DAC, and ran it through the 851E analog preamp, the results aren't nearly as good as the measurements I posted recently in the Digital Audio section for the 851D preamp, which DOES have an analog volume control based on the same concept as the 851E, using a multiplying DAC.
For comparison, here is the 851D on the same type of CCIF HF intermodulation test, with the volume control enabled, at 0 dB attenuation:
CCIF_18-19kHz by Jon Hancock, on FlickrThat is certainly food for thought, as it increases the potential value proposition for the 851D.
Meanwhile, I think I'm going to have to setup the AURALiC Vega in the main system with the TotalDAC and see what I think about that- a little low level channel imbalance doesn't strike me as much of a problem right now... :W

Comment